
问题
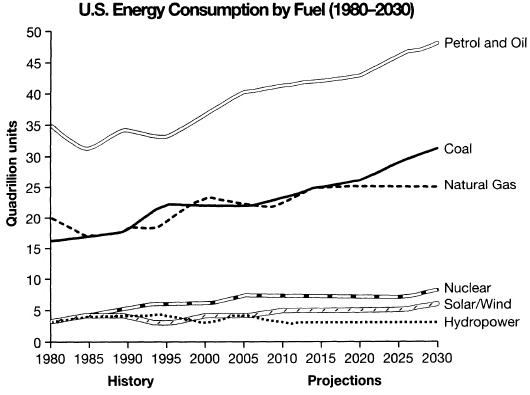
You should spend about 20 minutes on this task. The graph below gives information from a 2
You should spend about 20 minutes on this task. The graph below gives information from a 2008 report about consumption of energy in the USA since 1980 with projections until 2030. Summarise the information by selecting and reporting the main features, and make comparisons where relevant. Write at least 150 words.
请帮忙给出正确答案和分析,谢谢!
-
暂无相关推荐
最新题目
-
You should spend about 20 minutes on this task. The charts below show the percentage of ti..
-
REFRIGERATORS are the epitome of clunky technology: solid reliable and just a little bit..
-
How does Nadia want her coffee?A.sweet and blackB.with milkC.black with no sugar..
-
The professor suggests that in five years time ______.A.City Link will be choked by traff..
-
The Development of the Modern Hot Air BalloonThe modern hot air balloon is constructed by..
-
Human Migration Human migration: the term is vague. What people usually think of is the p..
 冀公网安备 13070302000102号